US Job Growth 2026: The Uneven Map That’s Reshaping Where (and How) We Invest
We’ve all felt it… that quiet unease when the national headlines say “economy stable” but your local news, your friends’ job situations, and even your own portfolio signals tell a different story.
As someone who’s watched markets through multiple cycles, I can tell you the February 2026 BLS state payroll data isn’t just another dry report. It’s a crystal-clear snapshot of exactly where opportunity is concentrating, and where risks are quietly building.
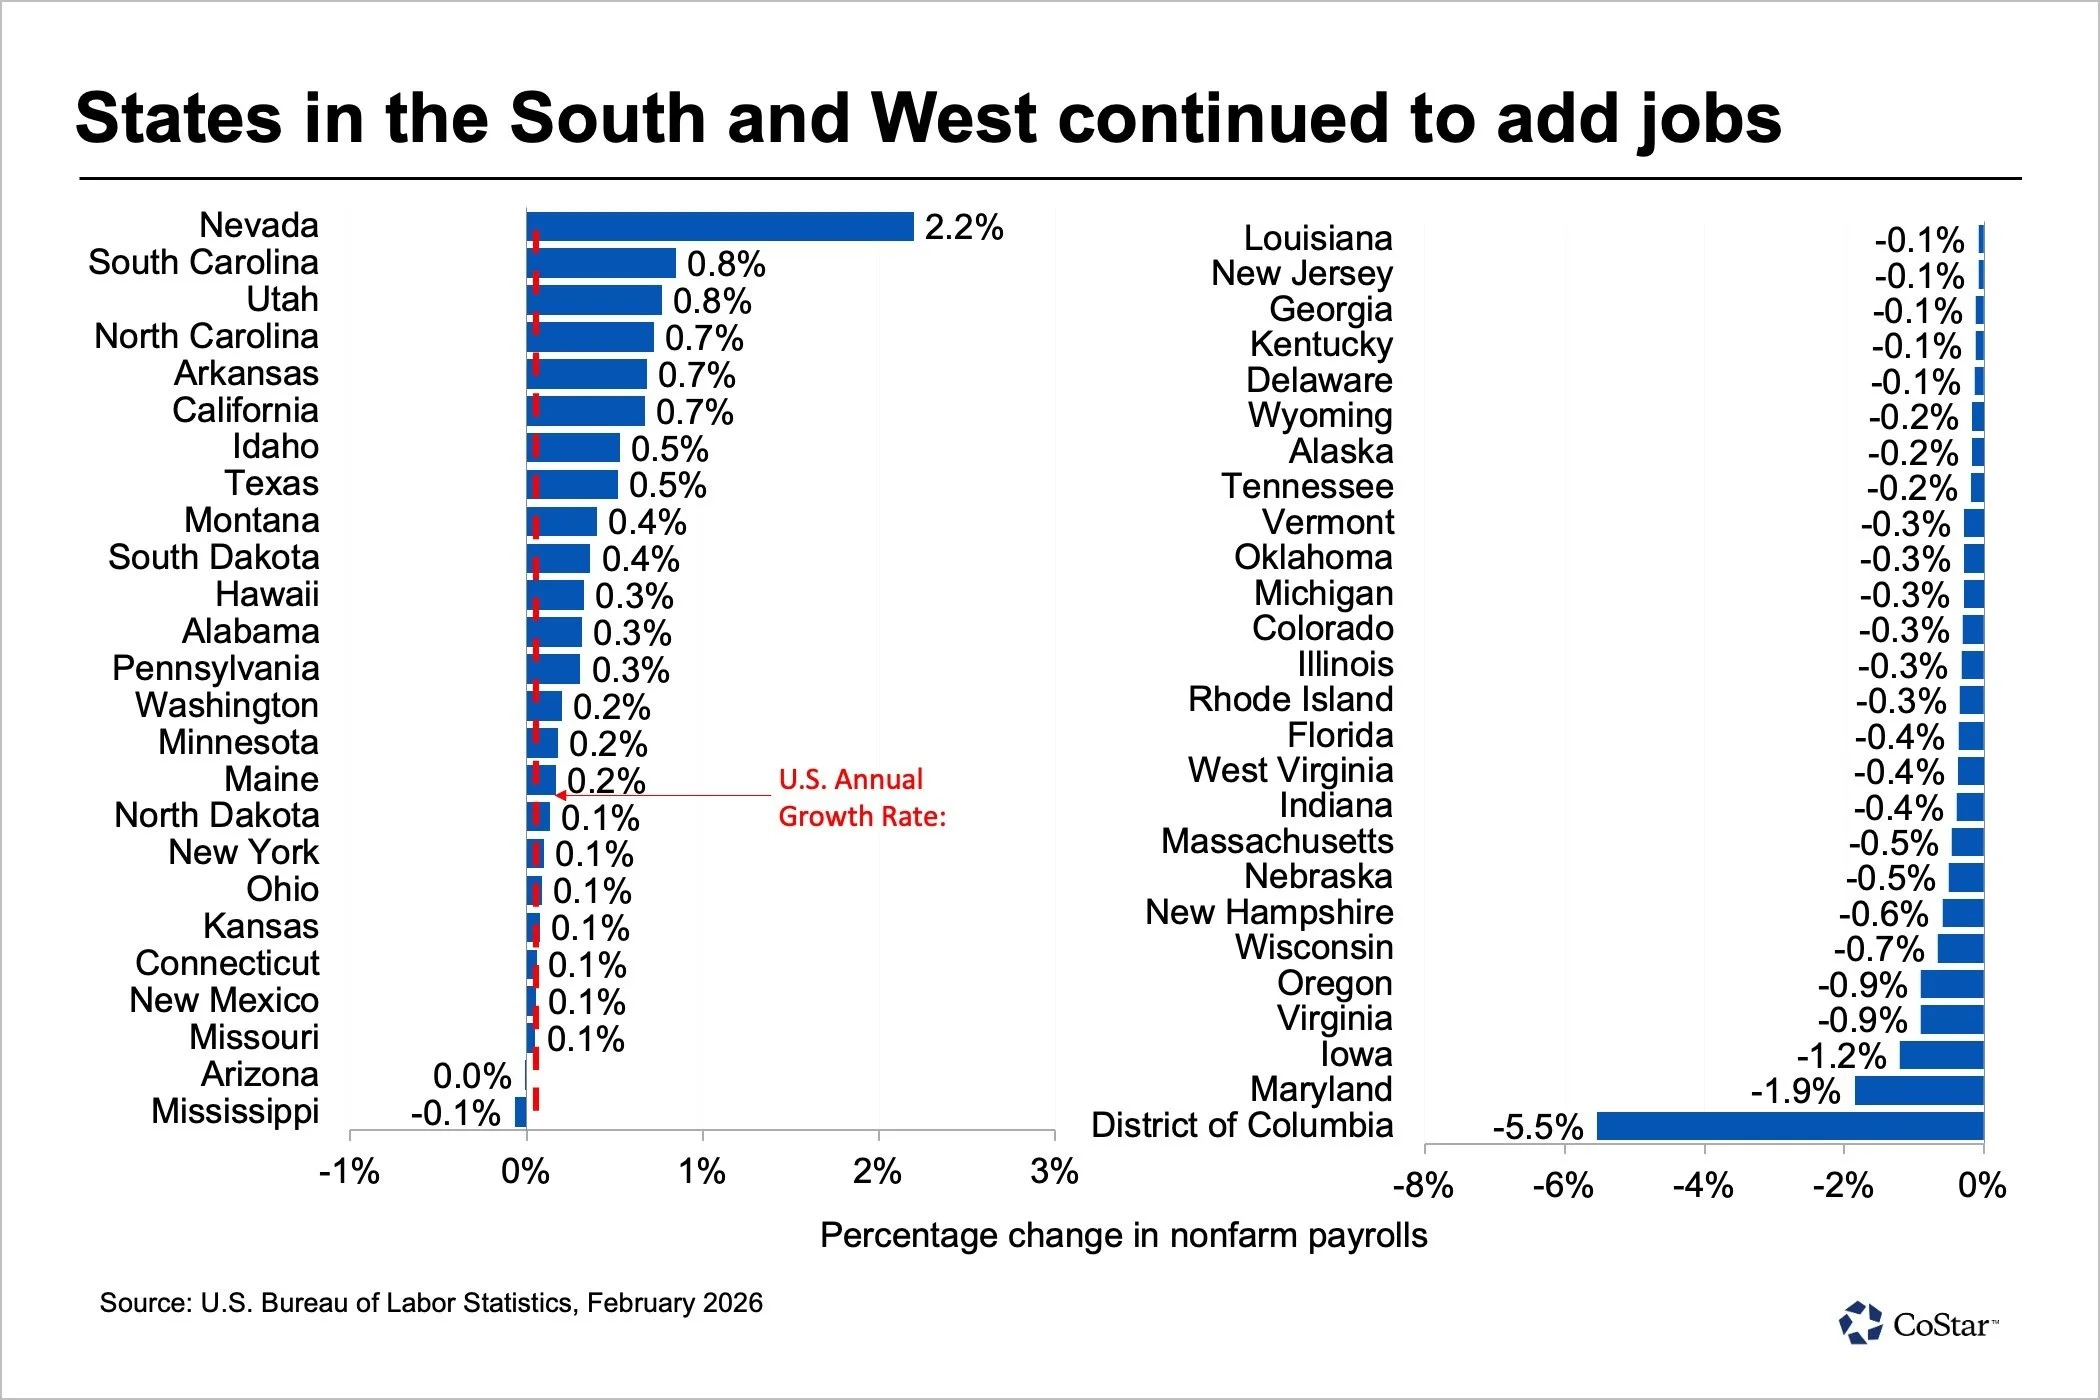
Only 23 states posted year-over-year non-farm payroll gains in February 2026. That’s down from 25 the month before and a sharp drop from the 45 states that were growing this time last year. The national annual growth rate? A paper-thin +0.1%.
Yet beneath those numbers, a very different story is unfolding depending on where you live, work, and invest.
South and Mountain West Are Pulling Ahead
Population growth leaders are turning into job-growth leaders, exactly as we’ve seen in past migration waves.
Nevada led the nation with a blistering 2.2% annual job gain, more than double the next closest states.
South Carolina and Utah both posted 0.8% growth.
North Carolina, Arkansas, and even California each added 0.7%.
What’s driving it? Domestic migration + targeted industry strength.
Nevada wasn’t just lucky; it was one of only seven states that actually added manufacturing jobs (+1.3%). Battery plants, EV production ramp-ups, aerospace, and defense work are fueling real payroll gains. Add in education & health services exploding at nearly 5%, and you’ve got a state where multiple sectors are firing on all cylinders.
We’re seeing the same migration-fueled lift in the Carolinas, Arkansas, and Utah: local services, professional services, and leisure & hospitality all growing because people are actually moving there with their families and spending power.
DC, Maryland & Virginia Are Paying the Price
Meanwhile, 27 states plus D.C. lost jobs over the year.
District of Columbia, 5.5% drop (the steepest in the country)
Maryland, 1.9% decline (worst among states)
Virginia, 0.9% loss
Iowa, 1.2% decline
The culprit is crystal clear: sustained federal workforce reductions. Government jobs alone plunged more than 11% in D.C. and 4.7% in Maryland. The ripple effects hit professional and business services hard, exactly the sector that feeds off government contracts in Northern Virginia and D.C. suburbs.
This isn’t abstract. When federal spending contracts, the accountants, consultants, and contractors who built their businesses around it feel it immediately.
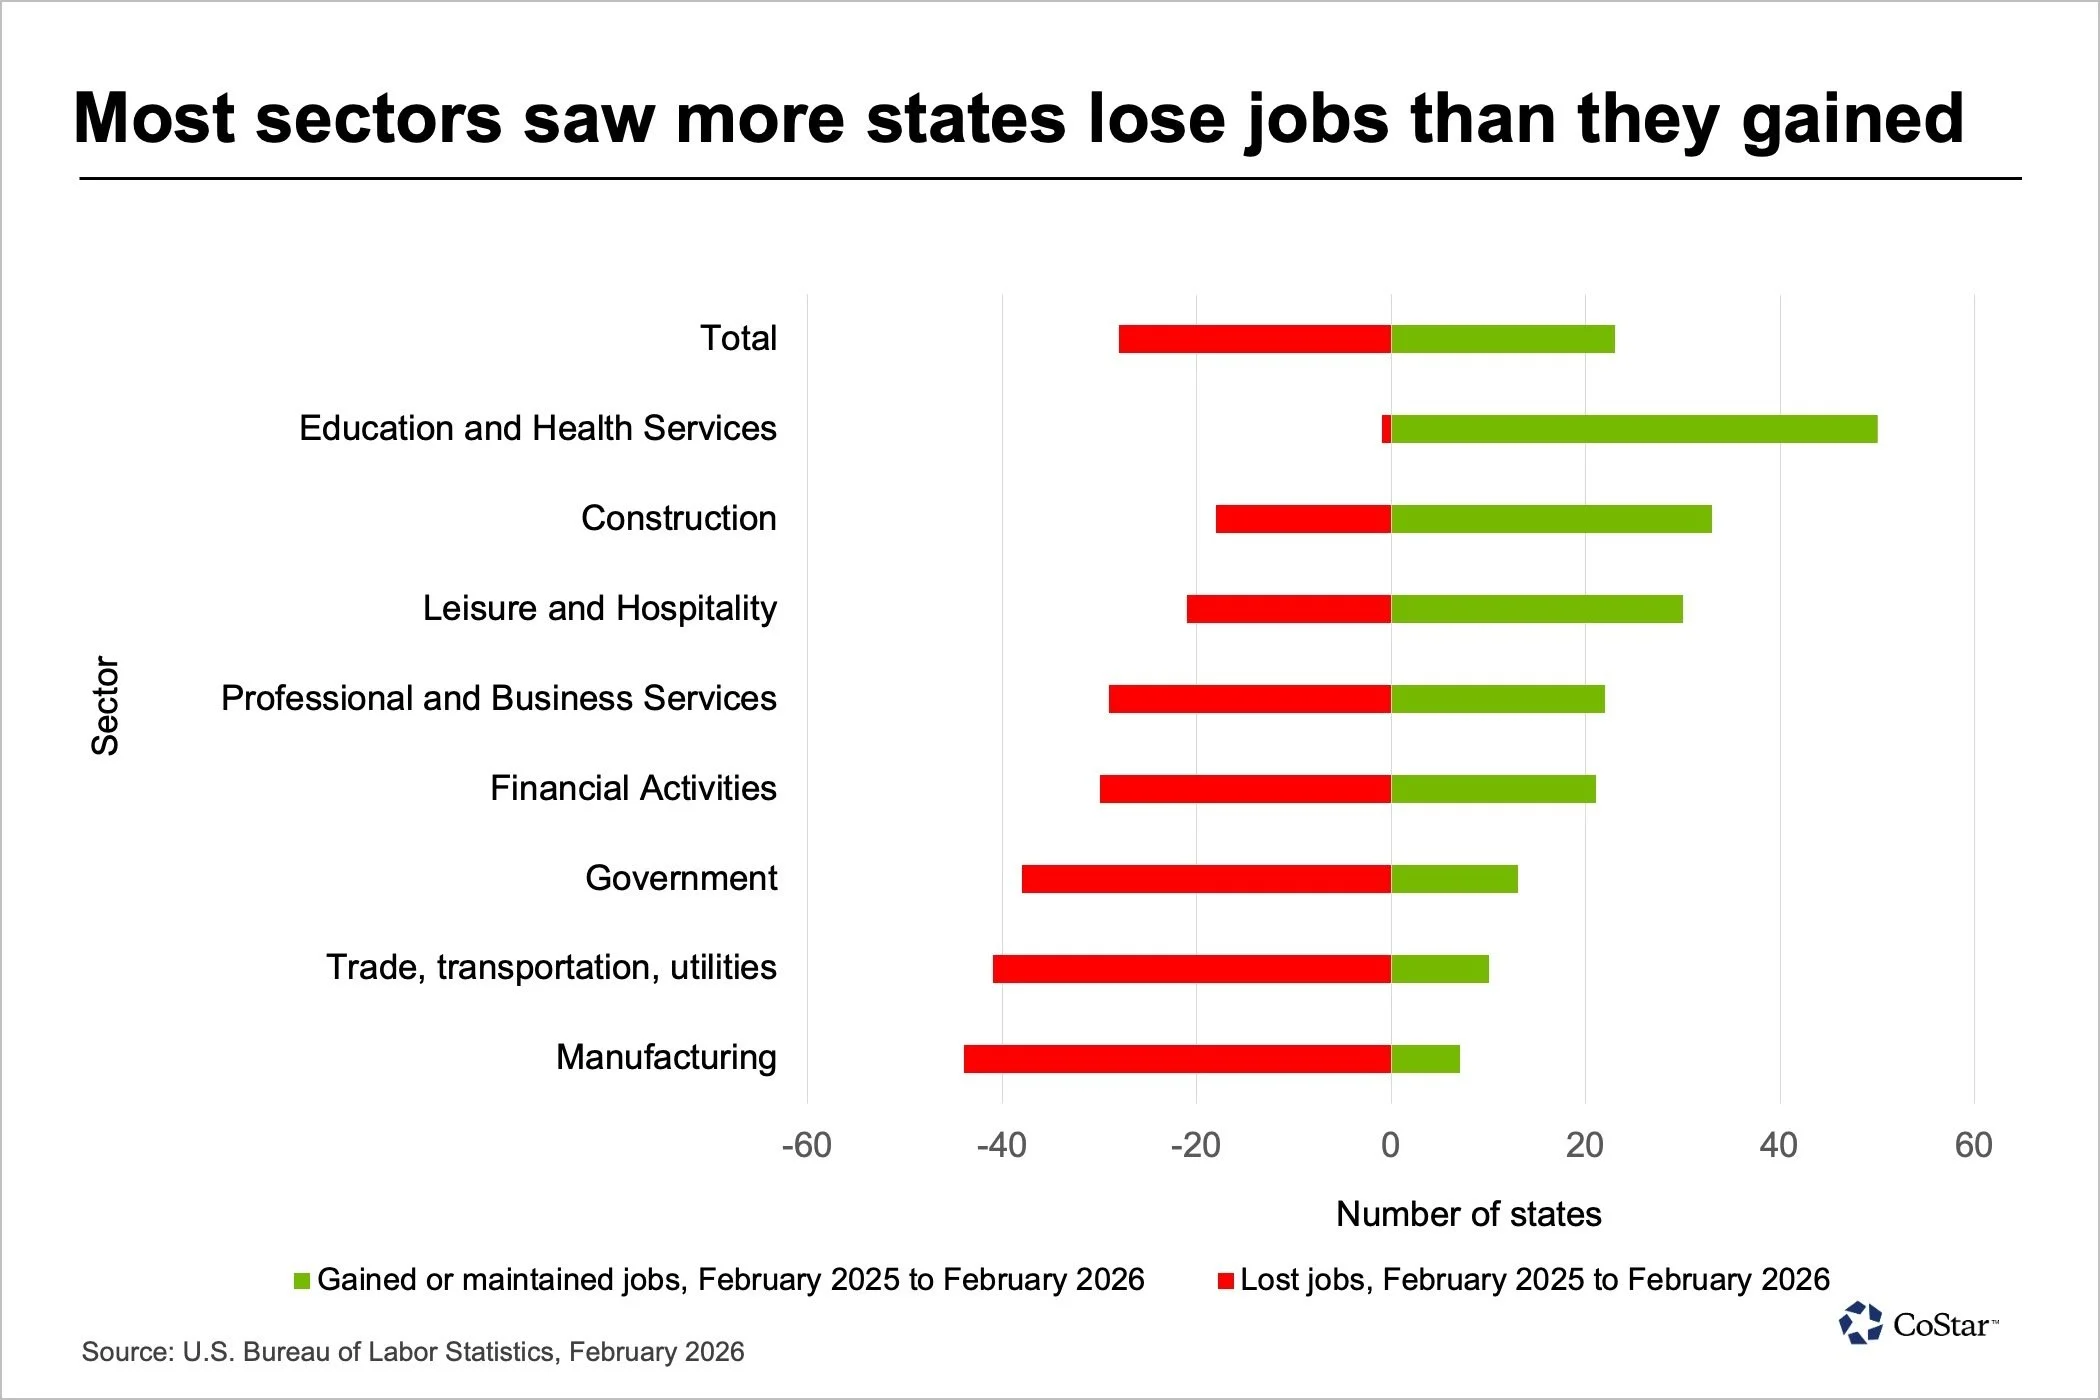
Sector Breakdown: Where the Jobs Actually Moved
Education and health services remained the most reliable growth engine, gaining jobs in every state except D.C.
Manufacturing showed real divergence:
Nevada +1.3%
Louisiana +1.2%
South Carolina +0.8% (helped by Boeing Charleston expansion)
Financial activities? Down 0.5% nationally, yet still growing in 21 states, with North Carolina leading numerical gains (+2,900 jobs).
Bottom line, we’re all watching: Cyclical sectors are rotating, but non-cyclical, locally-driven sectors (healthcare, education, local services) are proving far more resilient.
March 2026 Brought a Glimmer, But Bigger Risks Loom
The national March jobs report improved to +178,000 payrolls and +0.2% year-over-year growth. That’s encouraging.
Yet the bigger picture we’re tracking is more complex. Global supply disruptions (Strait of Hormuz: tensions cutting off oil, fertilizer, and LNG flows) are keeping inflation pressures elevated. That reality makes it far harder for the Fed to cut rates, even as labor market cracks appear.
A stagflationary setup for the rest of 2026 is no longer a remote possibility. It’s a live scenario we have to position around.
What This Means for Us as Investors Right Now
The February 2026 data confirms what many of us have been sensing: the U.S. economy isn’t moving in one direction anymore. It’s splintering, and that creates both danger and enormous opportunity for those paying attention to regional and sector rotation.
The states and sectors winning today are the ones likely to keep compounding as migration, manufacturing onshoring, and demographic shifts play out.
Disclaimer: This article is for informational and educational purposes only. It does not constitute financial, investment, tax, or legal advice. Past performance is not indicative of future results. Always consult with a qualified financial professional before making any investment decisions. Individual results will vary.
If the uneven job map we’re seeing in 2026 has you rethinking how your portfolio is positioned for the next 12–24 months, let’s talk.
I’d be happy to have a →private conversation about alignment.